“With modern data infrastructure, we can shed the rust, liberate the collective curiosity of our team, and change the way our companies innovate in industry.” – Tomasz Tunguz | Frank Bien, Winning with Data
We have entered a new age of data. The purpose of a data stack is to take all the disparate data an organization has and make it accessible. You might think of terms such as data-driven and democratized data, and imagine a work day with transparent data, succinct meetings, and clear decisions.
In practice, however, the old methodologies often fall short. Most often, what you’re left with is one of two things: data chaos or a data bottleneck.
A better data stack for your business
Take advantage of evolving cloud technology for faster processing and cheaper storage. Shape your own future — one where your business data is controlled and clear but also adaptive. It’s all possible with a better model of data centralization. And it starts with a new order of operations: ELT (extract, load, and transform).
The messy desk of reports: data chaos
You find yourself mid-dream, as a CEO from the ‘90s. In front of you is a desk piled with printed charts and spreadsheets, strewn around and spilling off the desk onto the office floor. You see reports from different departments, different vendors, and different partners. Data from across your organization – it’s a dream come true… but as you begin to compare two reports, you realize your dream is a nightmare. Dates are off, metrics are wildly different, and some departments haven’t even provided their reports.
Today, your world may not look that different. Data chaos is a work-state filled with flat-file exports of different datasets from different time periods, where individuals work in Tableau or Excel to massage the data into a format that benefits them. While data insights can be gleaned, the process is tedious, involving manually exporting and loading data. It often leads to inconsistent metrics, both within a team and across teams.
All this chaos leads to analysis paralysis due to your distrust in the data. Fed up with the chaos, you hire a team of data analysts, architects, and engineers to bring order to the chaos.
Too much data, too little compute: Data bottleneck
The next night, you find yourself in another dream, this time as a CEO from the early 2000s. You’ve wised up to the woes of the ‘90s CEO and decided to get your data organized. You’ve made the investment in a proper database, you’ve got servers on-premise, and you’ve hired a team of engineers and architects to maintain and organize your data. They extract data from your disparate sources, take that data through a meticulously curated and maintained transformation step, and load it into that database through a process known as ETL (Extract, Transform, and Load).
Now things are organized, and after countless thousands of dollars and years of work, you can get the report you’ve always wanted… but there’s another problem. Something has changed: fields have been renamed, the business has acquired a smaller organization, there was an organization-wide re-org, a vendor has adjusted their weekly report, and the board wants a report on some very different metrics. Data is in flux, and while your data stack is organized, it adjusts slowly, and takes time and resources to fix. Business users start lining up to get changes done or custom reports built. Your new nightmare is known as a data bottleneck.
Out of frustration, many companies will backtrack down the path of data chaos, bypassing the data team or taking reports given to them and working on them individually.
Luckily, you wake up from this nightmare. The sun’s shining and you can hear the promise of a new tomorrow.
The new data stack
Imagine it: a tomorrow when your organization can take advantage of the evolving cloud technology, which offers faster processing and cheaper storage. You are controlled and clear, but more importantly, you are adaptive.
The first element that enables such changes is the introduction of a massively parallel processing (MPP) data warehouse. You might already have one, but we’ll tell you about our favorite, Snowflake, a cloud-based option which has some unique features. Snowflake makes computations easy and economical, which facilitates a major change to the data pipeline: rather than ETL, the warehouse is powerful enough to transform the data itself. We’re left with a new process: ELT (Extract, Load, and Transform).
This new process drastically simplifies the extract and load process. Transformation pre-load is a painstaking time consuming process which is the bane of many data teams existence. Now, all we need to do is extract and load a one-to-one copy from the source to the warehouse. Our favorite tool is Fivetran, a fully managed and scalable extract and load tool.
Lastly, the data platform tool Looker enables us to use a model to define the relationships between our data, giving organizations real-time access to self-serve analytics, complete with report and visualization functionality.
Say hello to the modern data warehouse: Snowflake
Put what you know about databases to the side for a second. Snowflake is a paradigm shift. It’s fully managed and cloud-based, eliminating on-premise headaches, but what really sets Snowflake apart is that storage and computation are separated. Because of this separation, you can spin up as many Snowflake compute warehouses as you need, each of which can access your data simultaneously. This lets you easily separate and organize compute resources depending on the task. For example, you may have one compute warehouse which is purely for loading data and another for analytics. You only pay for the compute costs you use, and you can easily scale up or scale down, and turn compute warehouses on or off to optimize performance and cost.
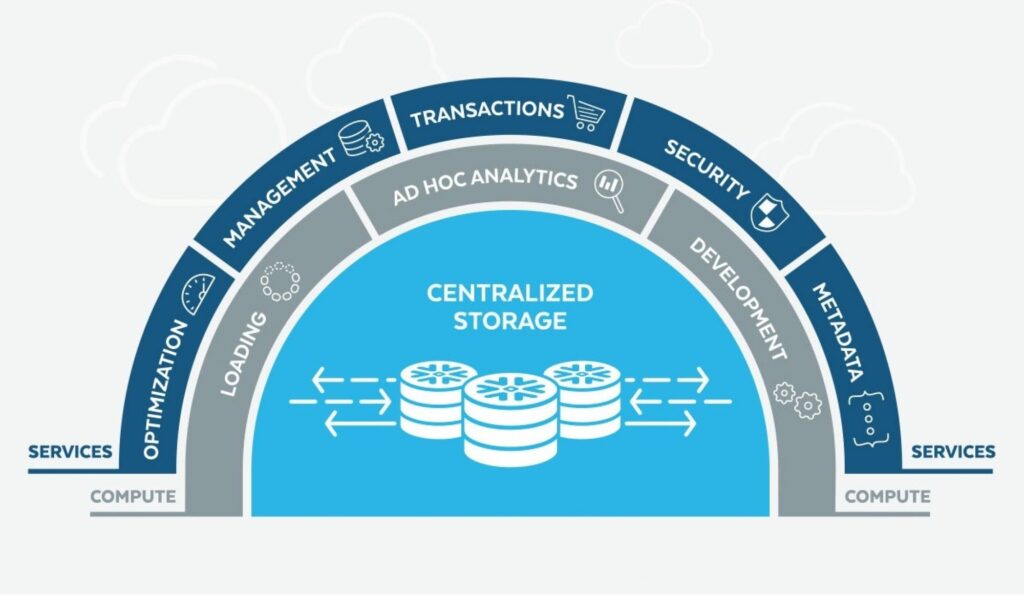
The second part of this is that storage is economical: for little more than the cost of storing data in Amazon S3, you can store all your data. Snowflake is built on either Amazon AWS or Microsoft Azure, based on your preference.
Snowflake is secure, as we expect from a modern company: every bit of data is encrypted on load and is decrypted on query. Permissions are easily set to allow certain users and roles to only access the necessary data. This is especially handy paired with the compute warehouses so that you know computation will only happen on the datasets which have been permissioned.
Lastly, Snowflake is SQL-based; it is designed for analytics across petabytes of data. However, it has also been optimized to handle semi-formatted data such as JSON or XML, easily parsing and transforming it at query time.
Scramble “ETL” to versatile “ELT” with Fivetran
Now that we have our massively-parallel processing warehouse in place, we can transform at query time rather than doing so before the load. This simplifies the task of data extraction and loading.
In the past, a classic approach might involve creating an app which would call, for example, the Salesforce API, then load each table into Snowflake. But tables change, servers go down, and errors occur. To deal with this, companies set aside engineering resources and continuous expense to maintain these pipelines.

Enter Fivetran. Due to the shift in the data pipeline, extracting and loading can be standardized and rolled out across multiple companies. Fivetran is simple to set up – enter your data source credentials (such as Salesforce) and your data warehouse credentials, and you’re off to the ELT races.
Fivetran has created scalable apps and methodologies, allowing them to offer fully managed connectors to hundreds of online tools and technologies. Along with these applications to warehouse connectors, they also offer a large array of database to data-warehouse connectors, such as Oracle to Redshift, MySQL to Snowflake, and many more.
The beauty of fully managed connectors is that Fivetran easily handles inserts, updates, and deletions with the capacity of loading millions of rows of data in minutes. Fivetran will adjust schemas and scale automatically based on your demand. Getting your disparate data into a single warehouse becomes a no-brainer. Now, you’ve turned your data bottleneck into a data waterfall.
Delve into the data lake in a badass submarine with Looker
Now that our data is loaded into our warehouse, it’s time to get to work. The first step is to handle any transformations of data. A typical workflow would involve maintaining a library of different SQL queries and snippets. Unfortunately, this leads us back into the realm of data chaos where different analysts end up using different queries, and it also limits data insights to those who know SQL. Solving this problem requires a data platform, and DAS42’s tool of choice is Looker.
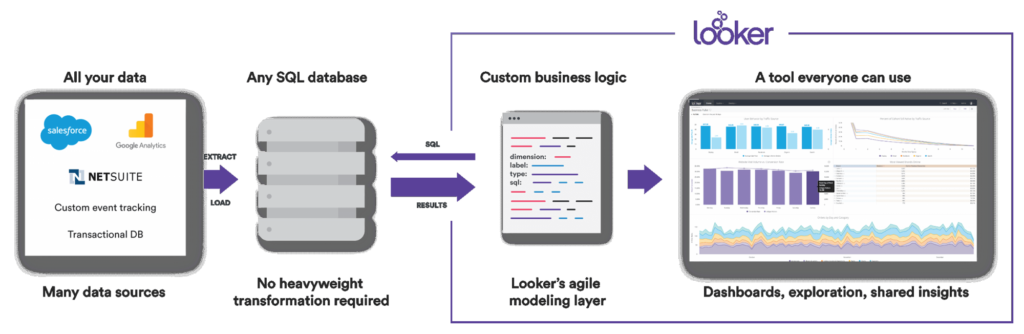
The first thing that sets Looker apart is data modeling. It does this through a SQL abstraction layer called LookML, which lets an analyst define all of the data relationships — relationships between data sources, data transformations, and metrics or aggregations. LookML is a programming language which is simple enough for spreadsheet pros and non-SQL-savvy users to understand and use, and a blast to work with for SQL pro’s.
This modeling layer paves the way to something previously difficult to attain: a single source of truth. In Looker, you can define a metric once and build upon it throughout the rest of your model. And when things change you can simply update that metric once and it will be updated across your model. Combine LookML with Git integration and you’ve empowered your data analysts by giving them full visibility and control over the data definitions and metrics. This is the new way of doing data governance: intuitive, elegant, and built into your workflow.
Once a model is defined, the self-serve analytics begins. Business users can now build reports, dashboards, and explore their data without knowing any SQL, and because they are working from a vetted and trusted set of metrics, they can use that data to make important decisions with confidence. These are the first steps towards creating a data democracy at your organization.
What’s more, Looker is more than a report-building tool, it is a data platform. That means that once you’ve created your data model, it’s not just your business users who can access your data. Through Looker’s API, OEM options, and scheduling abilities, you can share data across applications, your partners, and your customers.
… but where to start?
We’ve covered a lot, and this has been a fairly high-level look into the new data stack. Furthermore, while this stack is our favorite for achieving data governance and democratizing your data in a timely manner, every organization is different, and your solution may require some customizations.
DAS42 provides cloud-based data analytics consulting and professional services. We help Fortune 500 companies access and understand all of their data, reduce the time to actionable insights, and empower organizations to make better decisions faster.

Services provided