“Liquid is a templating language that you can use in Looker to create more dynamic content. For example, you could build URLs to external tools based on the results of a query or change which database table is queried based on a user’s selection.”– GoogleCloud
In some cases, a client or stakeholder may request the ability to drill down into a visualization to gain an understanding of the underlying data. While this may sound like a simple task, it may not always be as easy as using a drill field parameter in the LookML layer. For example, when working with running total measures, attempting to drill down on a specific data point will only return the data that corresponds to that specific date. However, we can make use of Liquid to dynamically “hack” Looker URLs, allowing us to display all of the data leading up to the selected point.
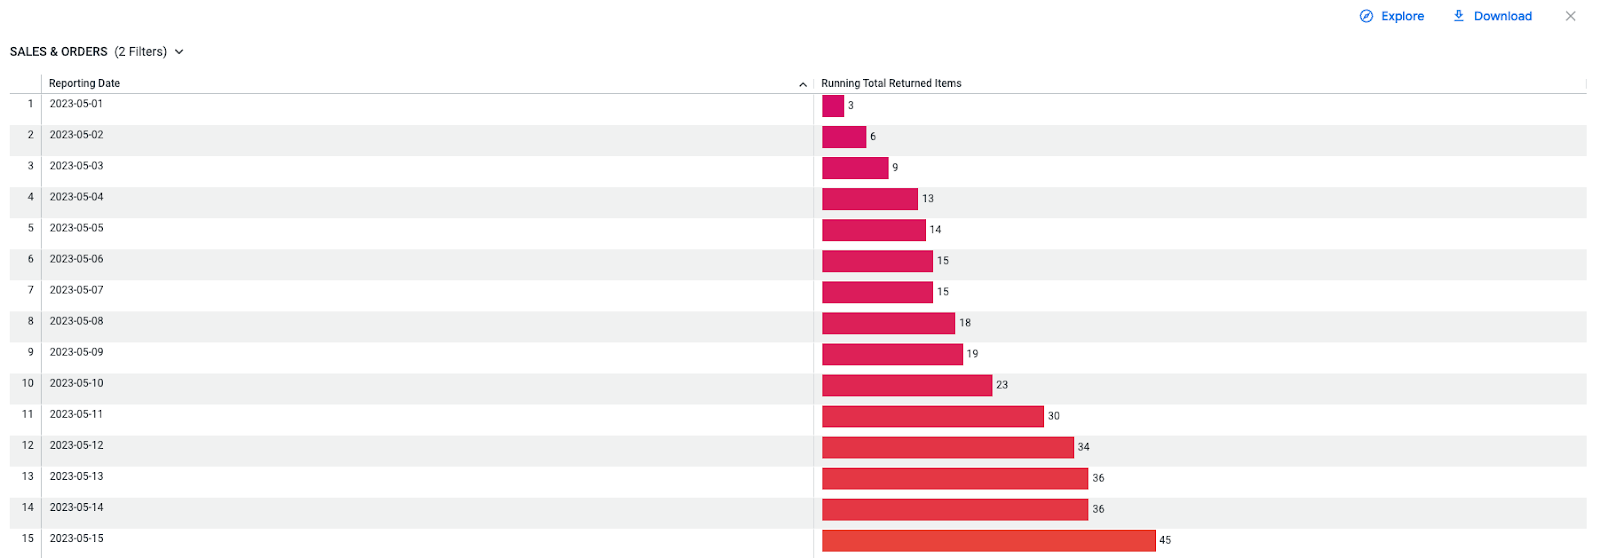
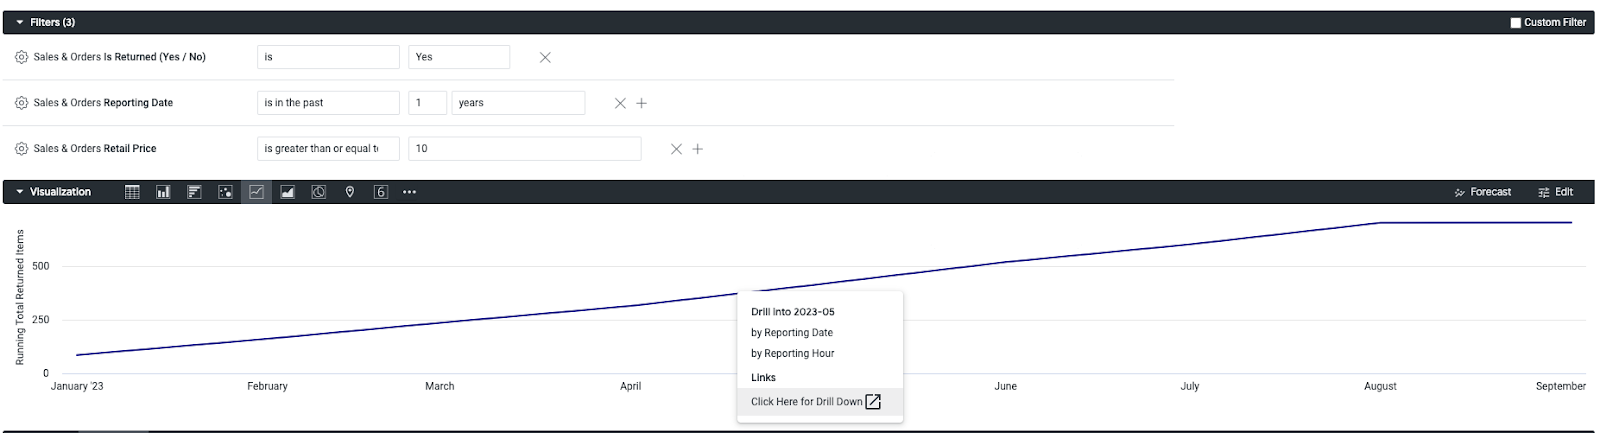
The figure below shows a basic visualization with the running total of every item worth at least $10 that was returned during 2023 in a theoretical e-commerce business. When we drill down on the month of May, we can see that only the daily values from that May are shown, while the January through April data that also contributes to the running total value is excluded. While we can specify additional drill-down fields using the drill_fields LookML parameter to obtain more detailed and/or granular details, drilling down in this manner will only ever give us the selected month’s worth of values. Luckily for us, we can access all of the data leading up to the highlighted week using Liquid Dynamic URLs.

Below is the table resulting from our basic running total drill down. We only have one month of data and can’t observe as many details as we might like. Let’s fix that!
In this tutorial, we will walk through one such use case to help you unlock Liquid Dynamic URLs for use in your own reporting. By the end, you will be able to:
- Generate a running total measure
- Make use of the link and URL measure parameters
- Create and edit both static and dynamic Looker visualizations using only a URL
- Embed Looker links in visualizations and notes
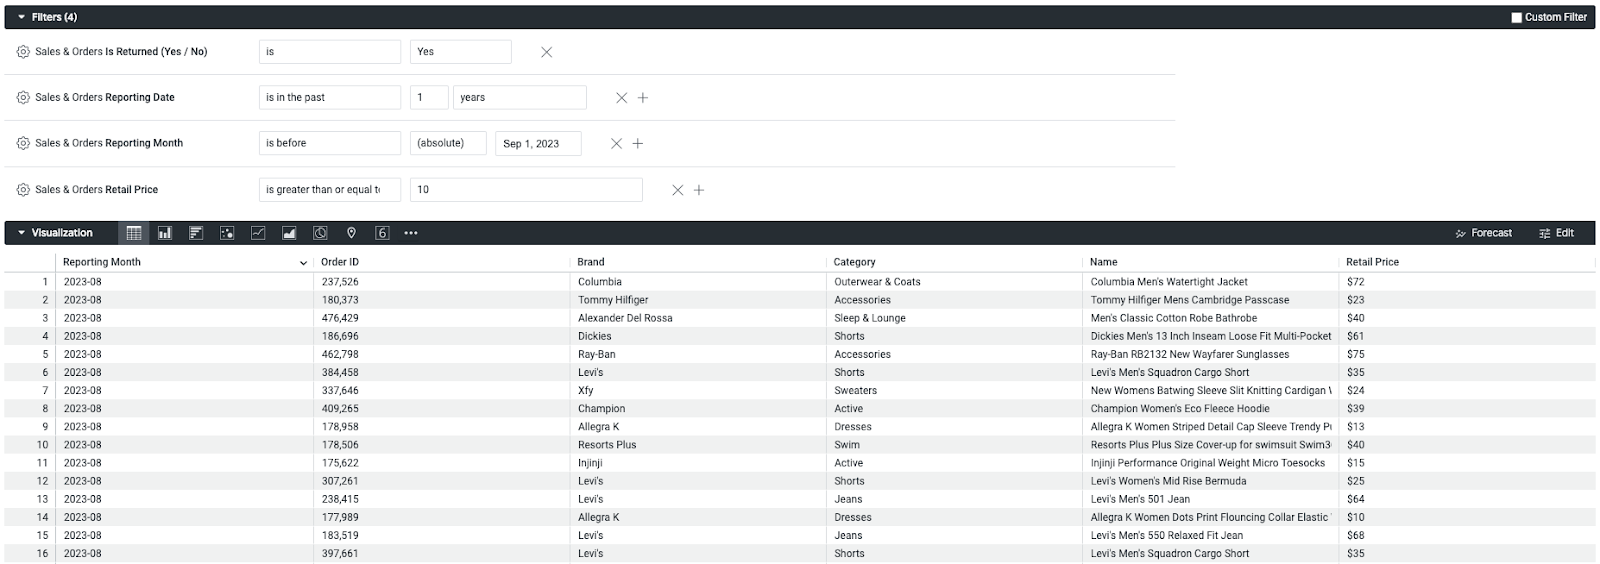
To start, we’ll want to create a visualization that will serve as the “baseline” for our drill down while making sure that all relevant filters that we want to carry over into our drill down are present, as well as all detail fields that we want to appear. For this example, we’ll be adding an arbitrary “is before” filter to our “is in the past 1 year” filter, choosing any arbitrary date. In this scenario, we want every value before the date we selected, but we also want to ensure that the drill down dynamically cuts off at whichever date was selected. It is important to note that separate date granularities were used for the two filters, as Looker URLs do not always accept multiple filters on the same field and granularity. In this case, the month granularity was used to filter to the last year, and the date granularity from the same dimension group was used for our arbitrary “before” filter.
We’ve included details we feel are important, including the order ID as well as the item brand, category, name, and retail price. Please note that any additional filters being applied to the original visualization will also need to be applied here so that the resulting drill down reflects those filters.
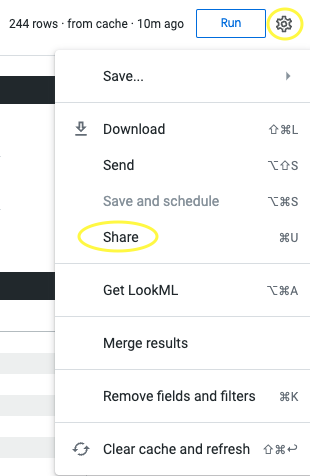
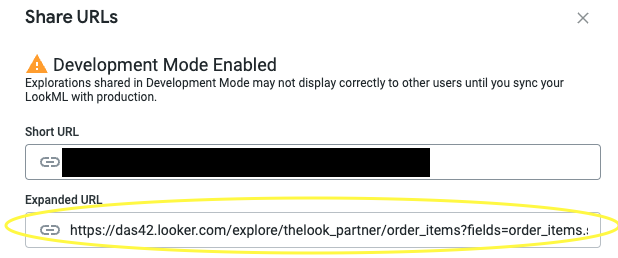
Now, we’re going to extract the expanded URL from this visualization by clicking on the gear icon on the upper right-hand of the screen next to the “Run” button. On the drop-down menu, click on “Share,” and then we’ll copy the “Expanded URL” as shown below.
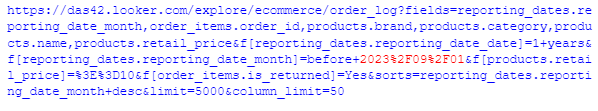
Once we’ve obtained this URL, we can begin to “hack” it into our dynamic drill down. There is a lot of extra text in the URL that primarily defines the formatting of the visualization. In this case, we only need to extract a simple drill down, so anything following the column_limit=50 parameter is going to be ignored. You’re free to alter other parameters and experiment with the graph settings as you see fit. For this example, we only need to demonstrate dynamic date filtering. Additional information can be found here. Our truncated URL can be seen below:
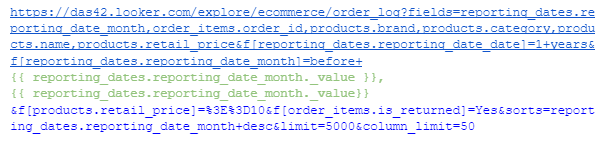
If we were to access this link (with the appropriate permissions), we’d get a URL-generated duplicate of the table we just created. Now, we can use Liquid formatting to hack this URL so that the dates generated are determined by the point on the running total visualization that we click on. In this case, we’ll simply replace the red highlighted date string (the arbitrary date filter we chose) portion of the URL with the Liquid formatted {{reporting_dates.reporting_date._value}}, where the _value will be dynamically dictated by what date is selected. After the substitution is complete, we’re left with the following:
Note: Looker “before” filters are exclusive, so the additional reporting_date_month._value also returns the selected month. This is unnecessary for “after” filters as they are inclusive.
Now that we’ve generated our dynamic URL, we can begin to embed it into a running total measure.

It is important to note that the above “returned_items” measure can be substituted for any distinct count measure. The key components of our running_total_returned_items measure are nested within the link parameters. The label parameter can be anything desired, though it should be noted that this label will be what end users select to dynamically drill down. Below that, we’ll insert our new dynamic URL into the URL parameter. We can now dynamically drill down on our running total measure. It should be noted that pivoted and/or transposed data may require the direction: “column” parameter as running total measures aggregate the distinct count field at the row level by default.
Returning to our original visualization, we now see the “Click Here for Drill Down” label has been added. Let’s give it a click!
Now, we find ourselves with a dynamically generated drill-down field that displays the detailed data leading up to the month we selected.

If you are curious to learn how DAS42 can help you make the most of Looker, please reach out at hello@das42.com, and we’d be happy to help!

Services provided