A leading international media and entertainment company launched a new over-the-top (OTT) subscription video-on-demand (SVOD) streaming service in the United States, followed by launches in international markets in 2021-2022. With an extensive treasure trove of compelling content across various brands, the streaming service gained a substantial number of global subscribers by the end of Q1 2022.
The challenge
The newly launched product was generating a significant volume of data (around areas like content, subscribers, acquisition, viewership, retention , etc.). Leadership could not harness the value of that data and gain access to meaningful insights without proper tools, workflows, and processes in place. In the current state at the time, business users were plagued with data quality issues, the maintenance and delays associated with manual processes, and a general lack of standardization across data sources.
The solution
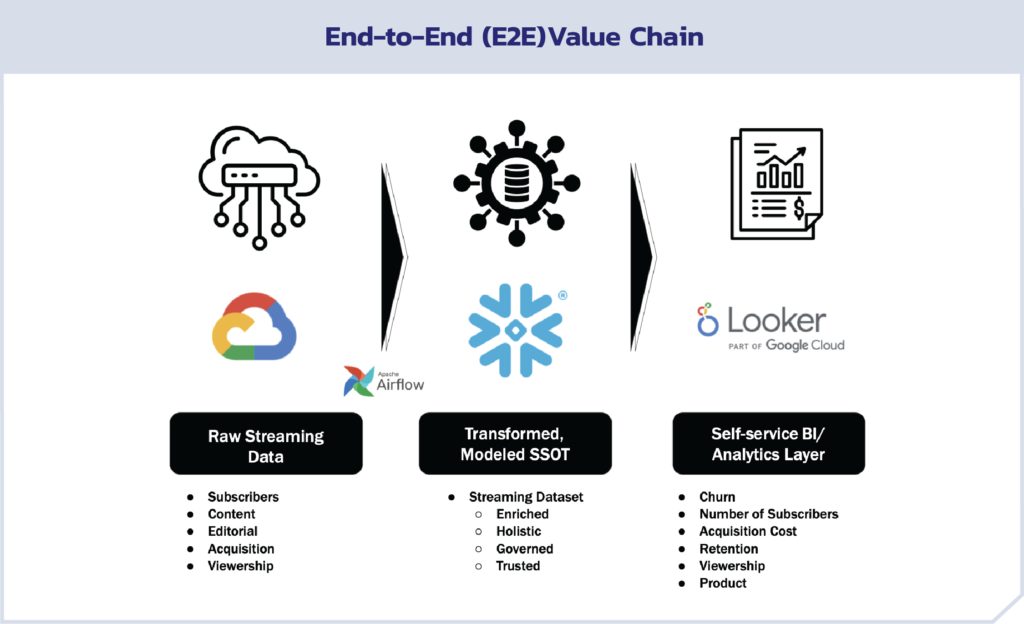
DAS42 helped architect, build out and optimize the platform, workflow, and visualizations which enabled automated Leadership BI Reporting, leveraging the modern stack of Snowflake, Airflow, Looker, and dbt.
Reports included key metrics on:
- Subscribers
- Retail and Wholesale Activations Paid Subscribers by channel
- Churn
- Revenue
- Activations
- Paid Subscribers
- Retail provider composition
- By SKU
- Product
- Tracking major launch titles and their performance
- Acquisition by Channel & Marketing (“Customer Journey”)
- Web visits
- Conversion
- Total Media Spend
- Subscriber Acquisition Cost (SAC)
- Cost per web visit
- Viewership
- Daily Active Users (DAU)
- Weekly Active Users (WAU)
- Total viewers
- Daily view in hours; in minutes
- Total views
- Views by device
- Top 20 series, movies, episodes, specials by viewers
- Retention and Cancel
- Monthly retention rate by tenure
- One month retention drivers (viewership, devices, behaviors)
- Paid Cancels
- By provider
- By tenure
- By subscriber type
We were also trusted with providing high-level strategic direction, which had a material impact on the use of data and analytics within the organization and helped bridge a sizable gap between business and technical stakeholders.
How did it turn out?
Armed with self-serve access to trusted holistic, governed, and enriched datasets built atop a modern, cloud-based platform, the Leadership Team now had access to business-critical information and actionable insights which drives real time decisions and strategy. The most valuable information is presented in a very accessible and consumable format, allowing for clear comprehension at the individual and organizational levels, driving timely decisions and actions. Leadership is able to access trusted and holistic data, giving them views into items such as:
- Total number of subscribers
- How many paid subscribers do we have?
- Combined with both growth and churn projections, what does our revenue forecast look like?
- How subscribers are accessing the service
- Retail channel
- Wholesale channels
- Subscriber acquisition and retention
- Quantifying Churn and related drivers- Why were subscribers churning?
- The effect of promotional activity on subscriber retention- How to market to them to increase retention?
- Content and editorial optimization based on what subscribers are watching and which shows/content drove retention
- Make marketing decisions in terms of where to invest based on:
- Behavior
- Demographics
- Region & Territory
Given the accessibility, quality and utility of the automated reporting, the Leadership team now is armed with the data they need to perform analysis, drive insights, accelerate remediation, and inform strategy. They can answer the core questions they need to operate and grow the enterprise, and are enabled to make very informed decisions as close to real time as possible.


Services provided