Thought Leadership
A new tool for Snowflake optimization (part 1)
Jeff Springer
Principal Consultant
January 9, 2023

Snowflake data platform
Snowflake is one of the most powerful data platforms available. Its separation of storage and compute provides near infinite on-demand availability and scalability. However, all that power and ability requires keeping a careful eye on your consumption and spend.
Snowflake has a pay as you go model for both storage and compute, so you only pay for what you actually use. Far and away, compute is the main cost driver. Within seconds, you could spin up a cluster of 512 nodes to crunch even the most complex machine learning algorithm. It’s going to cost you about $17 per minute, but you can do it. It’s like being given the keys to a Ferrari, and not just any Ferrari. You’re getting a Ferrari LaFerrari.
Controlling your spend
We provided a quick guide for properly sizing your virtual warehouses last month. To continue the focus on controlling your Snowflake spend, we want to introduce a preview feature just released by Snowflake for analyzing your queries to ensure optimum performance and maximize ROI.
There are two major tools available for analyzing query performance in Snowflake. The shared SNOWFLAKE database has over 80 views and table functions covering everything you would want to know about your usage. In particular, views such as METERING_DAILY_HISTORY, QUERY_HISTORY, and WAREHOUSE_METERING_HISTORY provide invaluable insight into compute spend. These views maintain an entire year of history so you can do trend and aggregate analyses to find patterns and address recurring issues.
The other tool is the Query Profile. For specific queries, the Query Profile presents a graphical representation of the query and each step Snowflake followed to arrive at the result set. This helps nail down specifically where opportunities for improvement lie. Though the Query Profile can only be referenced for queries run in the past 14 days, much of the data in the Query Profile can also be found in the SNOWFLAKE.ACCOUNT_USAGE schema. However, two very important common query problems identified by the Query Profile are only available there. Until now.
“Exploding” joins
“Exploding” joins typically occur when there’s a many-to-many relationship between two tables and the join conditions aren’t specific enough to result in either a one-to-one relationship, or a one-to-many relationship. This results in far more records being returned than the individual tables would indicate is possible. We can use the CUSTOMER table from the shared SNOWFLAKE_SAMPLE_DATA.TPCH_SF1 schema to illustrate this point. Running this query won’t result in any row explosion:
select
c1.c_name
from
snowflake_sample_data.tpch_sf1.customer c1
join snowflake_sample_data.tpch_sf1.customer c2
on c1.c_custkey = c2.c_custkey
where
c1.c_acctbal > 3000
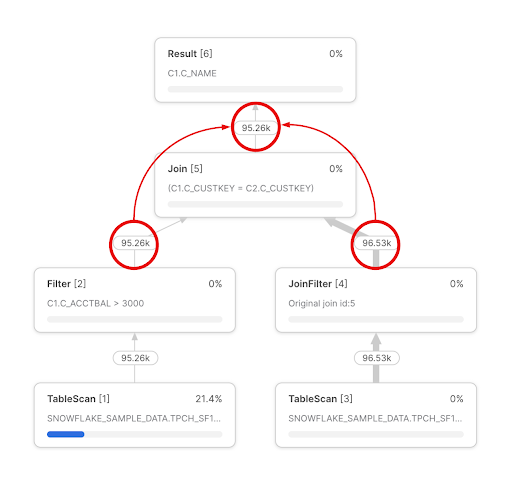
;We’re simply joining the table to itself on its primary key resulting in a one-to-one relationship. The query profile looks like we would expect; the number of rows returned after the join don’t exceed the number of rows in the combined two tables:
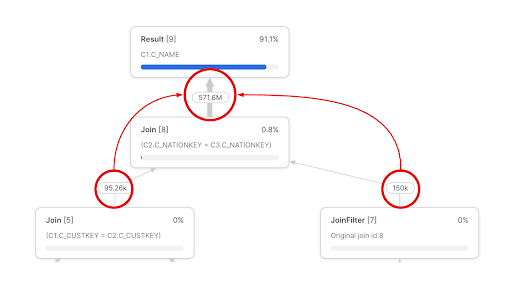
However, if we join on c_nationkey, we create a many-to-many relationship resulting in 571.6 million rows!
These issues are relatively easy to pinpoint in the query profile IF the query is fairly straightforward, but when is that ever the case? Thankfully, Snowflake has recently released the GET_QUERY_OPERATOR_STATS table function to programmatically return all the information available in the query profile. There are a few considerations to keep in mind, though:
- The function takes a single query ID as its input, so you can only analyze one query at a time. Focus on queries you run often, and query patterns.
- It can only be used on queries run in the past 14 days, so there’s not much history. Again, if you’re focusing on queries which run often, this shouldn’t be a hindrance.
- Since it’s a table function, you must use it in a FROM clause and wrap it in TABLE(). For example:
select *
from
table(
  get_query_operator_stats(‘01a92489-0506-61d2-0000-0389059613b2’)
);
Please note this is a preview feature so its functionality could change. We don’t recommend using it in a production environment at this point.
Running this function on our first query (non-exploding) returns these results:

As mentioned above, the get_query_operator_stats table function returns all the information presented in the query profile. However, we’ve parsed out some of the variant fields and limited the results to focus on the fact that the join didn’t result in an explosion of records. We input 191,795 records and output 95,264.
If we run the function on our second query (exploding), we get:

In this case, we actually joined the customer table to itself twice – first on the c_custkey, then on the c_nationkey to illustrate how easy it is to identify exploding joins. The results are clear. The first join (row 2) is essentially the same as our first query – we input 191,146 rows, but only output 95,264 rows. The second join (row 1) is where our row explosion occurs. We input 245,264 rows and output 571,649,564 rows. Assuming this is not expected, we can refactor this query, and this specific join to ensure a more efficient query.
Conclusion
The get_query_operator_stats table function is a fantastic new feature in a long line of Snowflake features introduced to help you control your costs. In this first post, we demonstrated how this feature quickly identifies exploding joins in your queries. In our next post, we’ll explain how the get_query_operator_stats table function can help you track down another pernicious, and costly query problem – unions.
If you’re too eager to wait, feel free to contact us today to talk more about how DAS42 can help you monitor and control your Snowflake costs. We are a Snowflake Elite Services Partner and winner of the 2022 Americas Innovation Partner of the Year award. We have helped all of our clients ensure they’re getting maximum ROI from their Snowflake implementations.
Read Part II Here